For years, changeover has been treated as an operational detail.
A scheduling inconvenience.
A planning constraint.
A production variable.
But in high-SKU food environments, changeover is no longer a technical metric.
It is a financial one.
Portfolio expansion is accelerating. Many branded food manufacturers expect to introduce an average of 57 new SKUs over five years. As SKU count increases, batch sizes shrink. Changeover frequency rises.
Each changeover consumes time.
- Cleaning.
- Mechanical adjustments.
- Parameter resets.
- Material swaps.
- Label and serialization updates.
Individually, these seem manageable. Collectively, they compound.
In documented production environments, low-volume variants have consumed close to 9–10% of total available capacity through changeovers alone. That is not downtime from failure. It is scheduled, structural capacity erosion.
And it increases as SKU count grows.
The traditional performance conversation still centers on peak throughput:
280 ppm.
300 ppm.
But peak speed ignores two destabilizing forces:
Changeover percentage.
Scrap percentage.
If a line runs at 280 ppm, but 10% of time is consumed by changeovers and 2% output is lost to scrap, effective performance is no longer 280 ppm.
It is lower.
Significantly.
What most dashboards measure is rated speed.
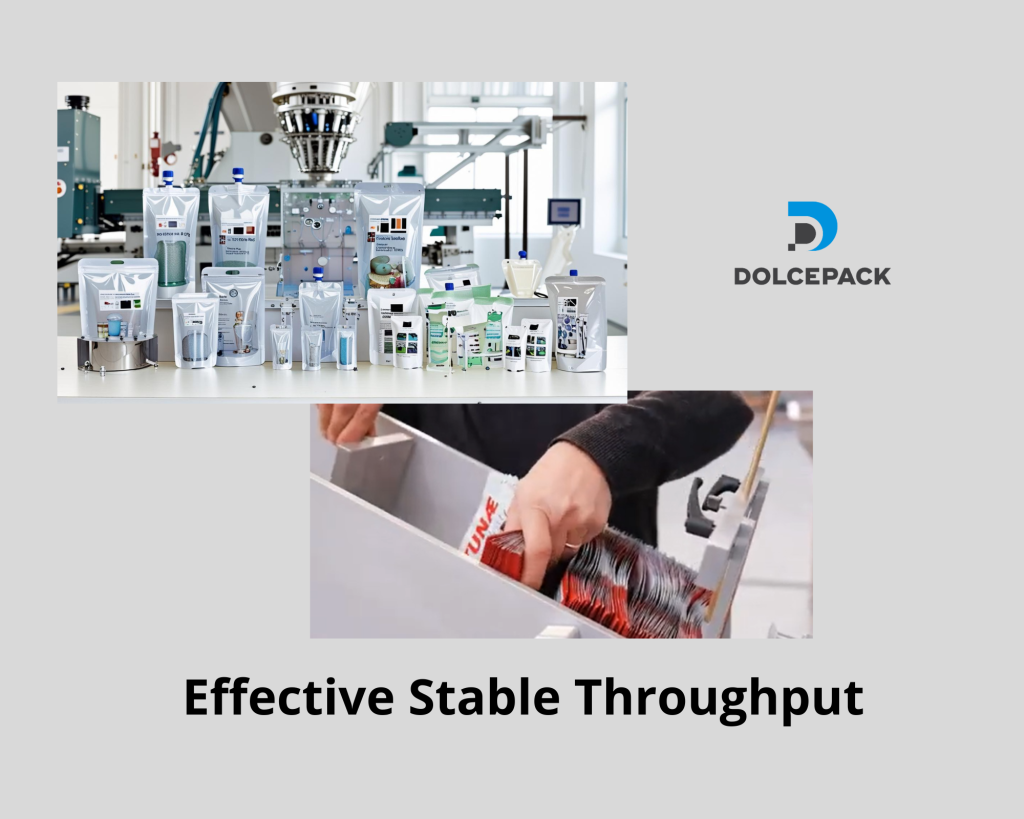
What financial outcomes reflect is Effective Stable Throughput.
Effective Stable Throughput can be expressed simply:
Rated Speed × (1 − Changeover %) × (1 − Scrap %)
As SKU growth increases changeover frequency, and startup variability increases scrap exposure, small percentages compound.
Over five years, even a 3–5% erosion in effective runtime can represent hundreds of thousands of units of lost capacity annually.
Without changing the machine.
Without reducing rated speed.
Without visible failure.
Minutes compound.
Are you tracking peak speed —
or Effective Stable Throughput?
Design the line.
Protect the investment.
Sources
• PMMI Industry Outlook Reports – flexibility and high-mix production trends
• VDMA Packaging Machinery Reports – modularity and changeover efficiency priorities
• CPG portfolio complexity research documenting 9–10% capacity consumption from low-volume variants
• Industry waste and startup scrap benchmark studies (sub-2.5% best-in-class performance levels)